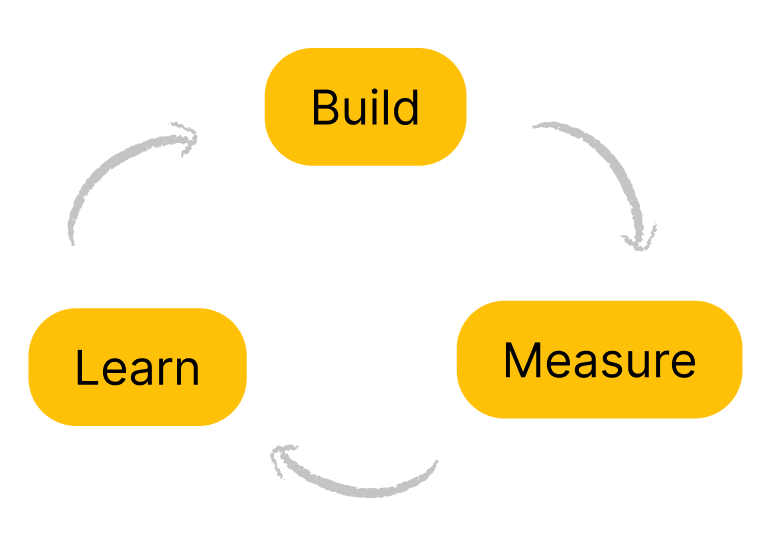
Build, Measure, Learn
Growth Engineering is based on experiments, and experiments will fail most of the times. Growth teams work on cycles, where they build, measure and learn something, also (and mostly) from what we are used to call “failed” experiments.
There are many aspects of this cycle that we need to cover for setting up an healthy Growth Engineering flow. We need to focus around relevant topics (WHERE and WHAT to build), we need to understand WHAT to measure and, of course, HOW to learn from each and every experiment.
Where to Build
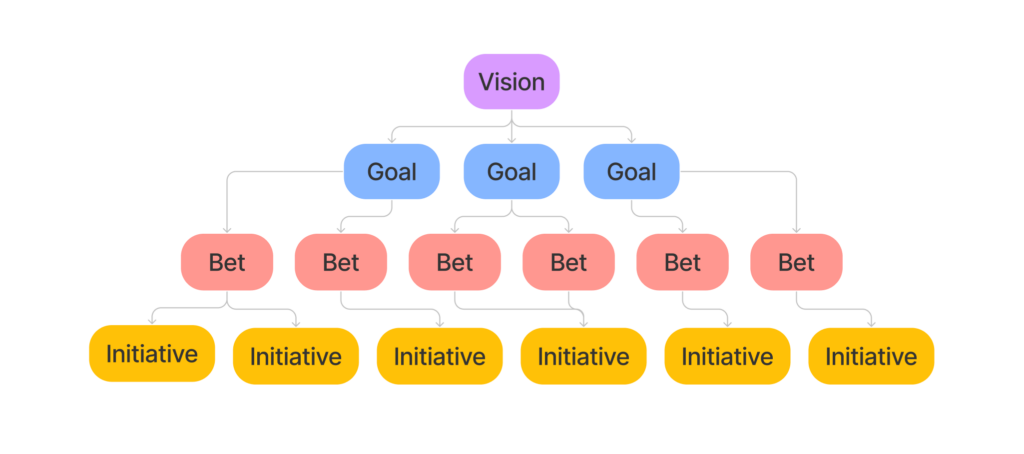
Focusing effort for growth [Lean Value Tree adaptation]
Large products and ever-changing platforms can be a very wide field to experiment on. While this provides room for many ideas, it is important to understand which parts of the system are most likely to produce relevant effects if tweaked, since you’ll probably want to address those first.
A good approach to this problem is an adaptation of the Lean Value Tree, which allows to split the main goals into focus areas, and safely brainstorm for experiments.
What to Build
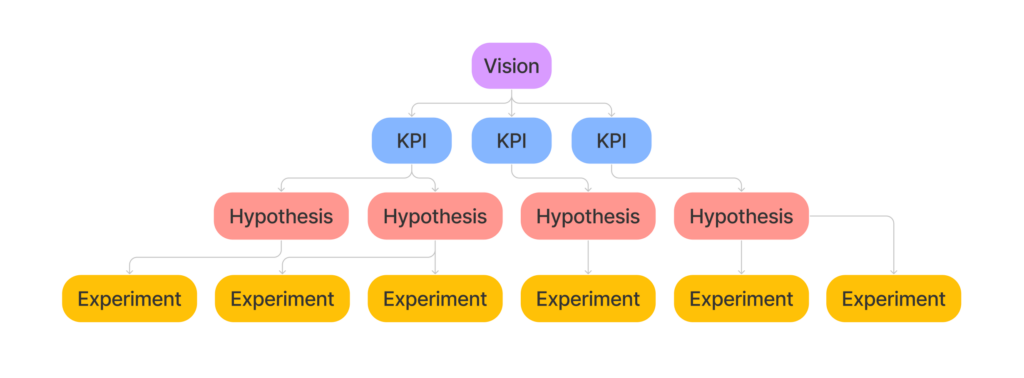
Validating the idea
Since we want to work on experiments and discovery, we can replace some labels and the tree can be a good visual reference for not getting lost into your product.
To validate ideas, we build experiments. We don’t want to spend too much time and effort on something that might not work, for then spending the same amount of effort on tearing it down if it shown to be the wrong way.
Build experiments small and quick, neglect some best practices (be wise please), get fast feedback
We are basically building something to understand what to build. Sounds like an infinite loop, right?
It is 🙂
What to Measure
Tracking the right events and A/B testing
Now, we decided to build an experiment around that feature, our hypothesis is that a yellower button would convert more. The experiment is trying with the new color, and we need to define how to track the results.
Frontend events vs Backend events
It is very important to set up our tracking system correctly. On a web platform, some events happen on frontend, while some other on the backend of the application.
In our yellower button scenario, we’ll want to track clicks from the frontend, but we may want to understand if that click then converted better by checking something on the backend. Is that the subscribe button? So, track the subscription event on the backend, and with these events you’ll be able to build a funnel on your analytics platform.
Clicking the button on the interface doesn’t mean the user successfully subscribed, and registering a new subscription doesn’t mean someone clicked the subscribe button.
(Think about APIs as an easy example to understand how these two sides can be decoupled.)
Why A/B testing
As the title of this section suggests, growth teams favor A/B tests. The reason is simple, and lies in the need of eliminating noise.
Think about all external factors which could affect the performance of your platform, such as seasonality, real world events, competitors’ moves, weather. All these factors have time in common, and you need to exclude the time factor. How? Having both versions (the original one, and the one you want to experiment) at the same time.
Through A/B testing, half of the users will get one version, the other half the other version, ideally at the same time.

How to Learn
How many dimensions can you visualize?
Three. As humans, we cannot imagine and easily visualize a space with more than 3 dimensions. That’s why math gets complicated at some point, right? And that’s why drilling down into your data will become an hard task, requiring some experience.
Think about the yellow subscribe button. Does it convert more users? Where do they come from? Is it working better on mobile or desktop devices? Is it performing best during lunch time or at night? Four simple dimensions, and we didn’t add the time axis yet.
How to deal with this? Be curious. You will start from the most obvious chart showing the top level metric defined by the experiment itself, and then you’ll want to drill down.
Each chart is useful, if it generates new questions
Sometimes numbers will be unclear. A and B versions of your yellow button may seem to perform the same, and that’s why you’ll want to understand what’s really happening for each specific segment of your user base.
More than this, sometimes that new shiny yellower button you had put all your expectations into, will fail badly in confirming your hypothesis.
You’ll realize that your users liked the previous version more and you’ll feel lost. But that’s where you learn, you’ll dig even more to understand why, and you’ll build the most valuable pieces of experience for your growth team.
A growth team will learn to set expectations around getting valuable information from their actions, rather than getting their ideas confirmed every time.
A failed test is still a successful experiment