

Every day, our podcast platform ingests millions of data points. For instance, we collect and process real-time information about episode listens and the ads requested by them. We also track each ad delivered within the listened episodes and the corresponding revenues generated by those ads. On top of that, and in order to provide the best experience for listeners, content creators, and advertisers, we aggregate these data at multiple levels (e.g. by day, month, podcast, organization, city, country, ad campaign, etc.).
From this point of view, we have a platform that is constantly processing thousands and thousands of time series (data points that evolve over time). Thus, detecting “unusual” events in those time series is critical to early assess the status of the platform and provide the best possible experience for all our stakeholders.
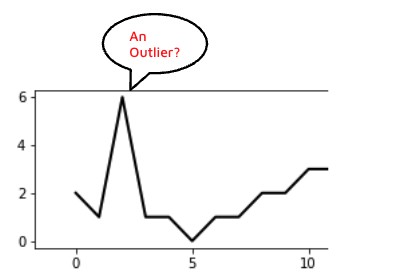
Detecting “unusual” events
In statistical terms, these “unusual” events are called outliers, and given the huge amount of data we have to analyze, it was clear that we needed an automated process.
Entering, the Outlier detection project…because, you know, knowledge is power!
The Outlier Detection Project was conceived to pinpoint unusual events in time series data encompassing listens, ad requests, ad impressions, and ad revenues. We also wanted to look for these rare events across a spectrum of granularities ranging from individual podcasts to global aggregations.
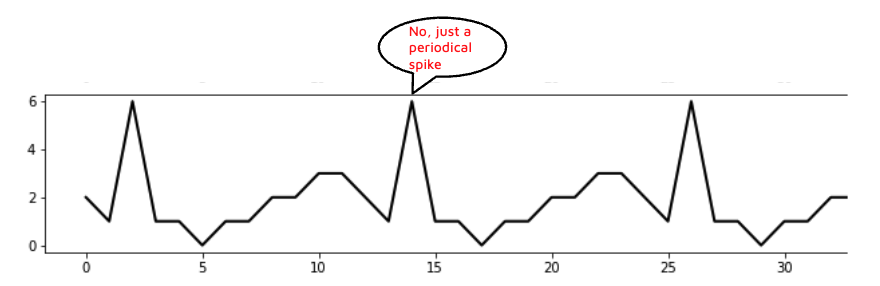
The first problem you encounter when trying to detect outliers in time series is to determine the correct amount of data points to analyze. Ideally, you would like to analyze long periods of time so you are better assessing the seasonal component of the signal (i.e. normal fluctuations that occur periodically over time. On the other hand, if you wait too much to analyze the data, you will not be able to react fast and correct things on time if needed. After several tests, we settled on a moving time frame of 65 days, with an early inspection window of 21 days for new time series.
What type of outliers do we want to detect?
Defining the types of outliers to detect is the next critical decision. In our case, we focused on identifying deviations that were significantly higher or lower than the expected behavior for a given time series. We also sought a tool that could monitor trends and seasonality changes.
At this point, it is worth noting that not all outliers are a sign of something going wrong. It is true that detecting them is very useful when trying to identify fraudsters (more on our fraudster detection system here) but outliers can also be generated by, for instance, a big ad campaign that starts to run on our platform, or a very popular show that migrates to Spreaker. Detecting outliers is also very helpful to catch bugs and misconfigurations and to monitor industry-wide changes.
How do we detect them?
After extensive experimentation, we decided to use a combination of detection algorithms that flag potential outlier events and their types through a final voting mechanism.
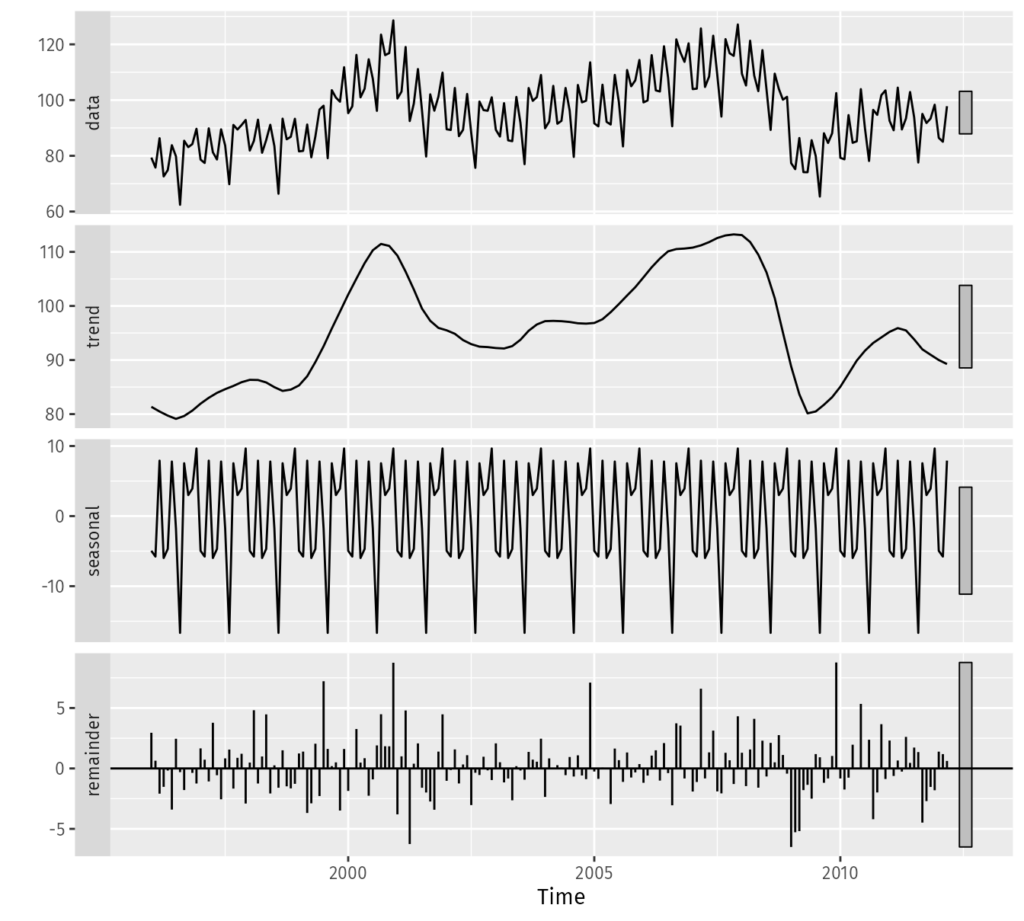
A prominent algorithm we employed is the Seasonal-Trend decomposition using LOESS (STL). This algorithm decomposes each time series into trend, seasonal, and remainder components. We then compute various evaluation metrics on each component and flag a data point as a potential outlier if the metric exceeds predefined thresholds.
Additionally, we implemented simpler strategies, such as computing the difference between each data point and the moving average (low-pass filtering) of the time series. As with the STL detector, we then flag the point as a possible outlier if it goes above or below some predefined thresholds.
Lastly, we collect all the data points that were flagged by the different detectors, and employing a voting mechanism, we make the final decision on outliers. This approach enabled us to detect a significant number of outliers across four crucial metrics—listens, ad impressions, ad requests, and ad revenues— and six dimensions ranging from individual podcasts to country-level and global-level aggregations.
Continuous monitoring and domain knowledge are key
The automatic detection process described above, though robust, is not infallible. During the fine-tuning phase, we opted for a system more inclined to generate false positives (data points that are wrongly flagged as outliers) than to overlook crucial outlier events.
Following a similar approach to our fraudster detection initiative, we designed a QuickSight dashboard that allows us to visualize and further investigate the potential anomalies.
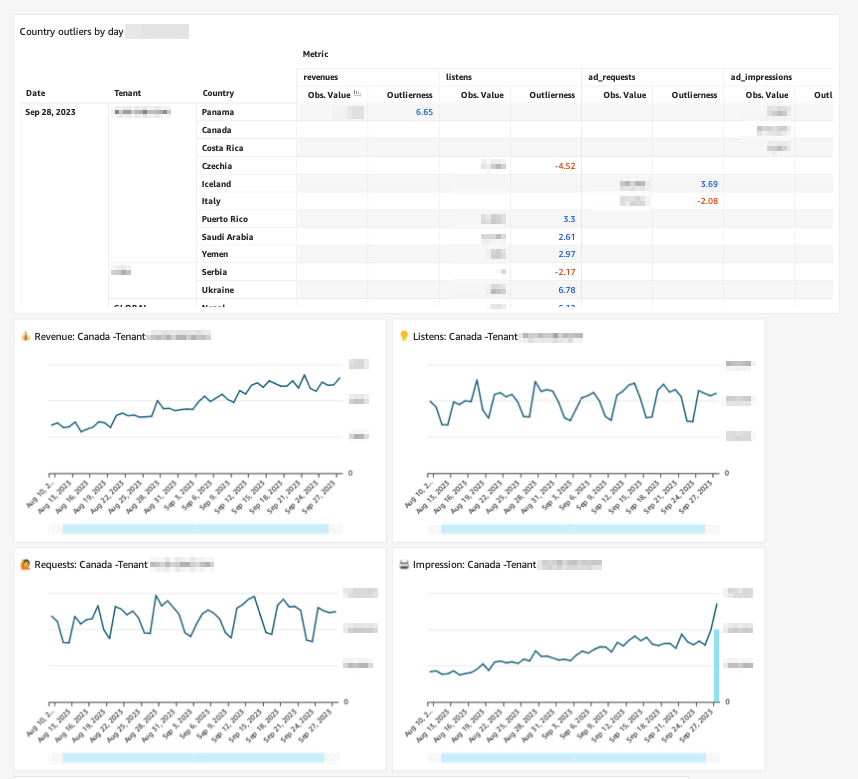
Our team conducts a daily check of the outlier dashboard, relying on domain knowledge to discern clear outliers from those requiring deeper investigation. Once validated, the team generates a comprehensive report highlighting the most critical outliers of the day, ensuring the entire company remains informed.
Conclusions
Our outlier detection tool has proven to provide timely and valuable information for enhancing our platform’s performance. Leveraging a mix of detection algorithms, continuous monitoring, and domain expertise, we have forged an excellent mechanism that is not only able to identify relevant outliers but also promotes synergistic collaboration across various teams thus, fostering our commitment to excellence in the podcasting world.